
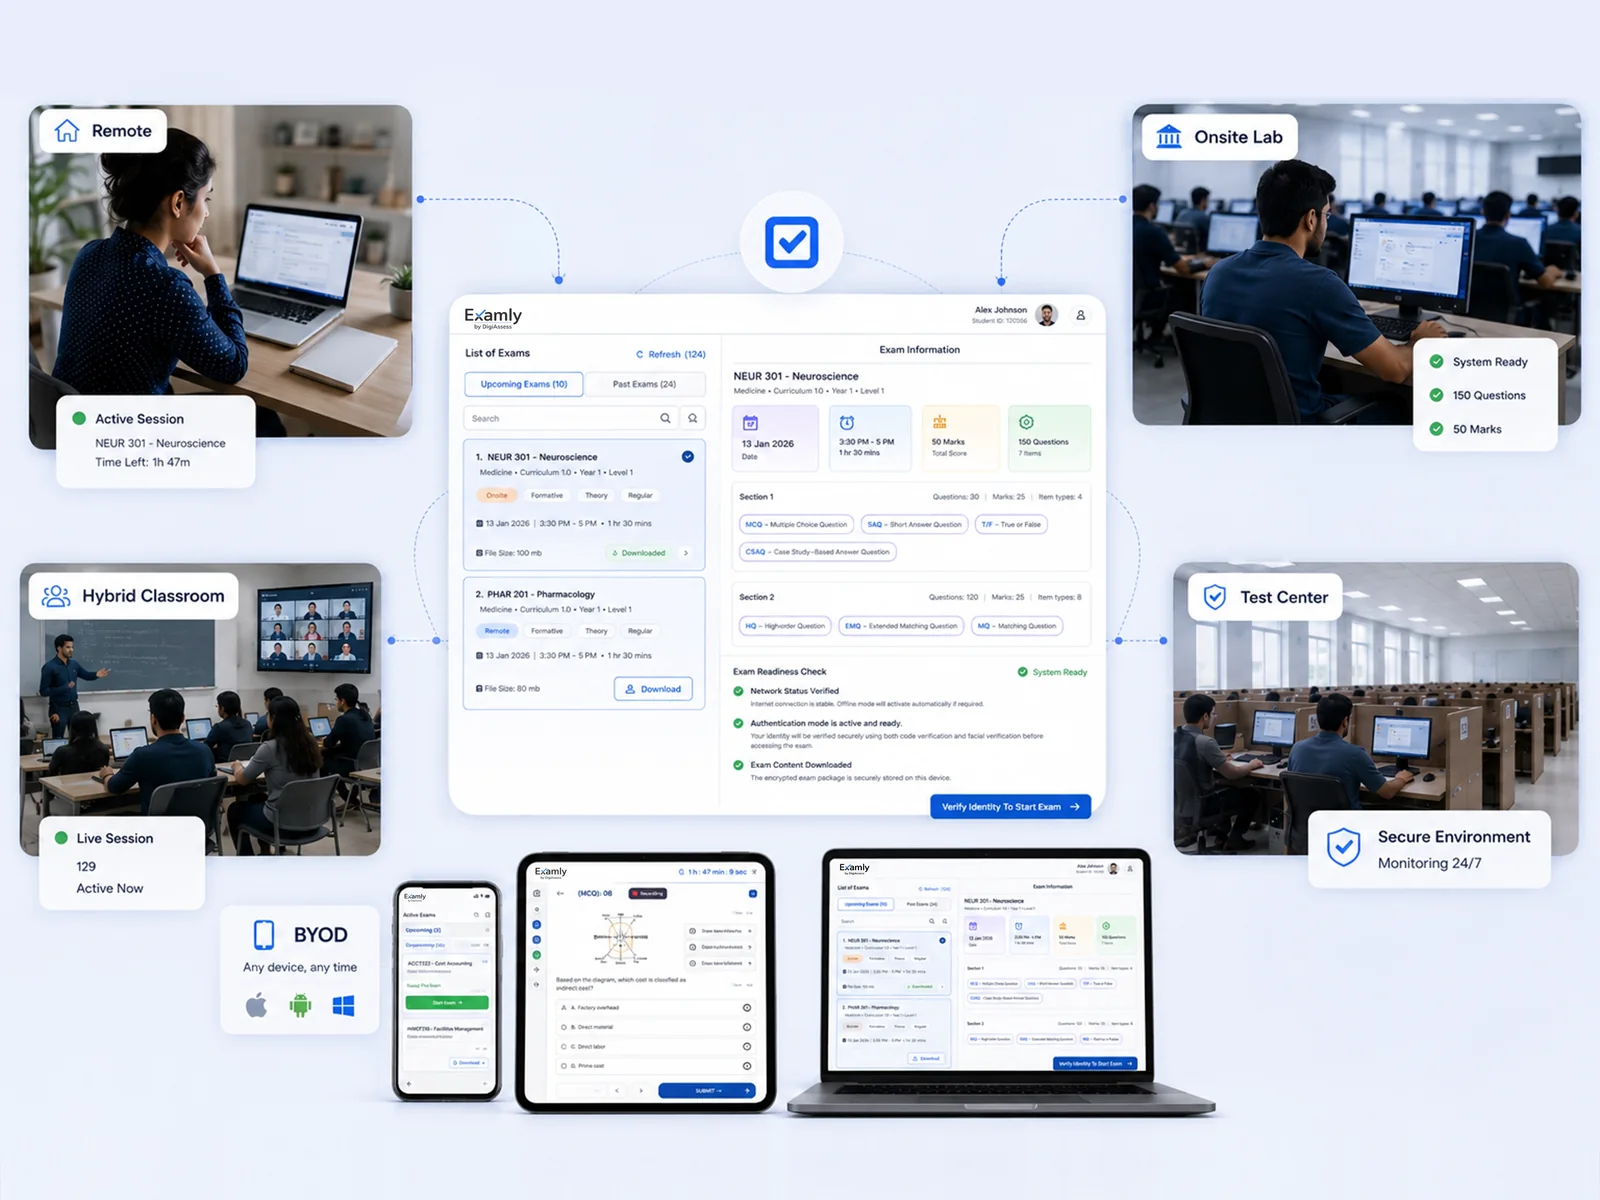


Assessment Data Should Do More Than Generate Reports.
Turn everyday assessment evidence into a continuous view of learning, competency, program performance and institutional quality.
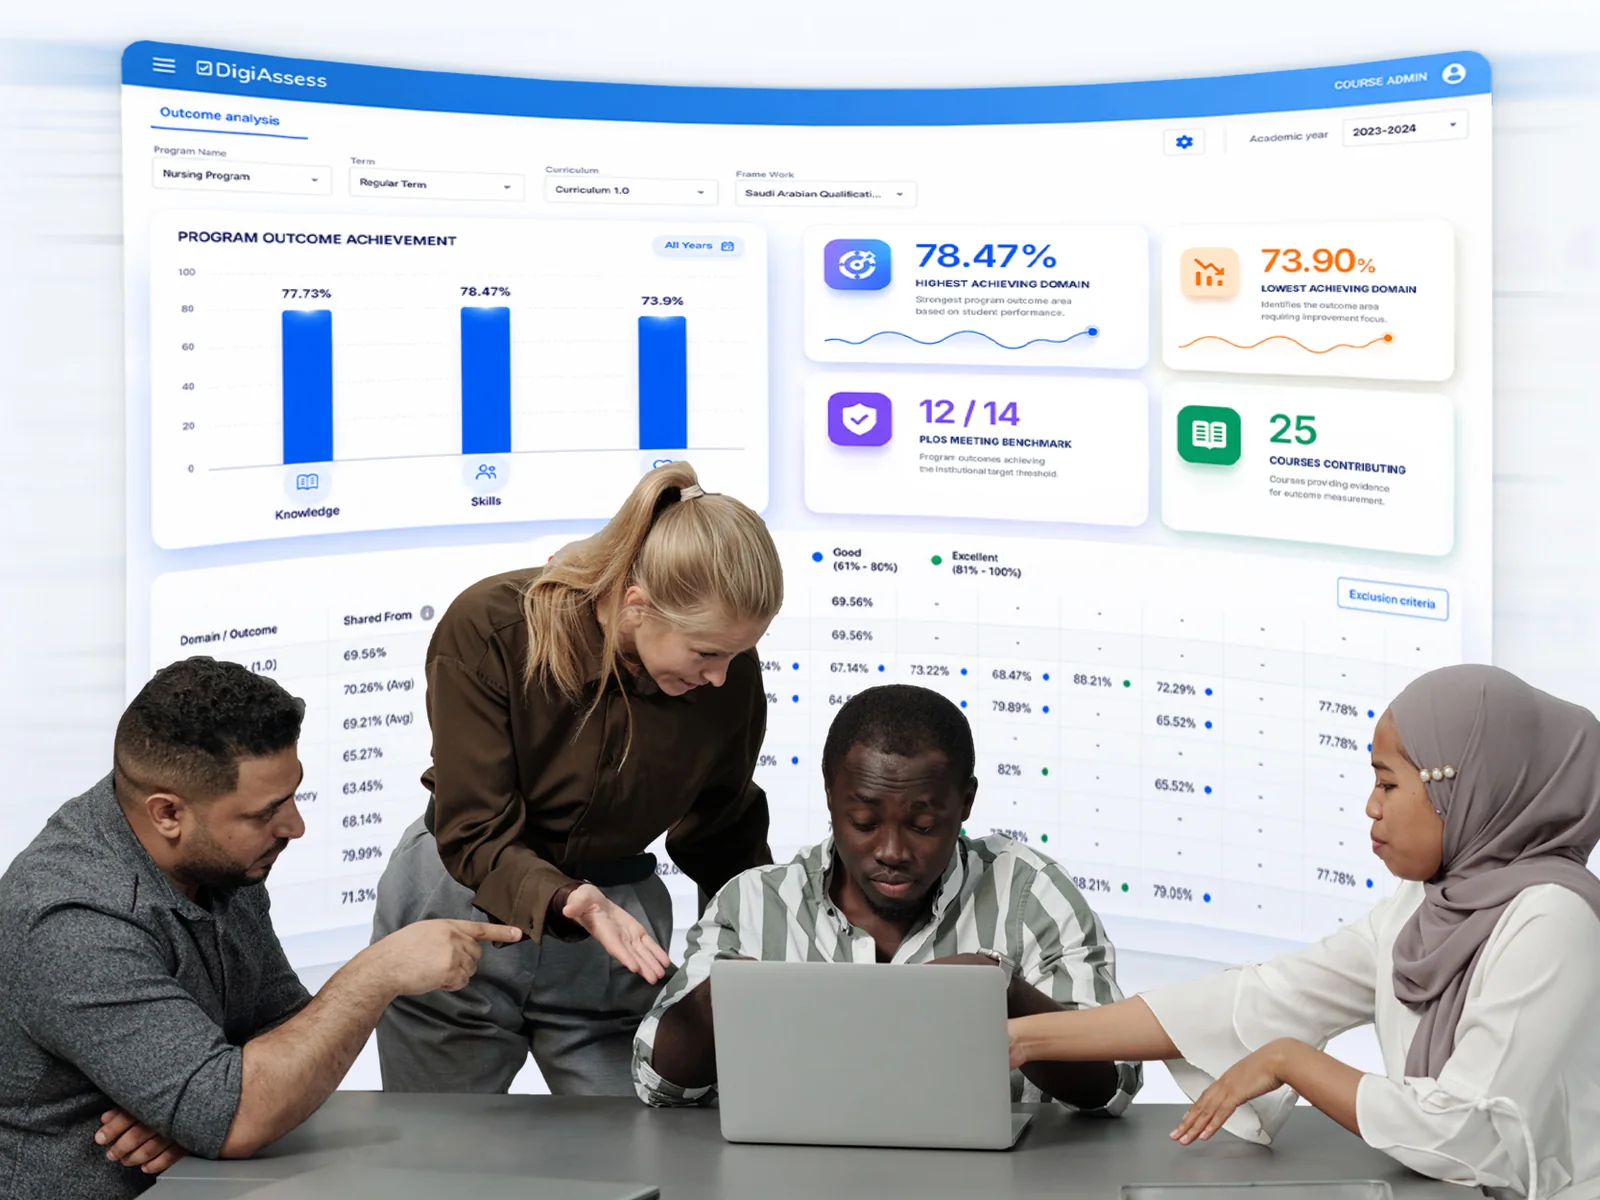 CLO attainment
Competency progress
Gap identified
Program insight
Marks Tell You Who Scored. Outcomes Tell You What Was Learned.
Map what the program intends before you measure what learners achieve. Connect questions and activities to CLOs, PLOs, competencies and EPAs, so evidence aggregates across assessments, cohorts and time.
- Question and activity mapping to CLOs, rolling up to PLOs.
- Competency, EPA and graduate-attribute evidence.
- Multiple frameworks mapped in parallel, with version control.
Make Progress Visible.
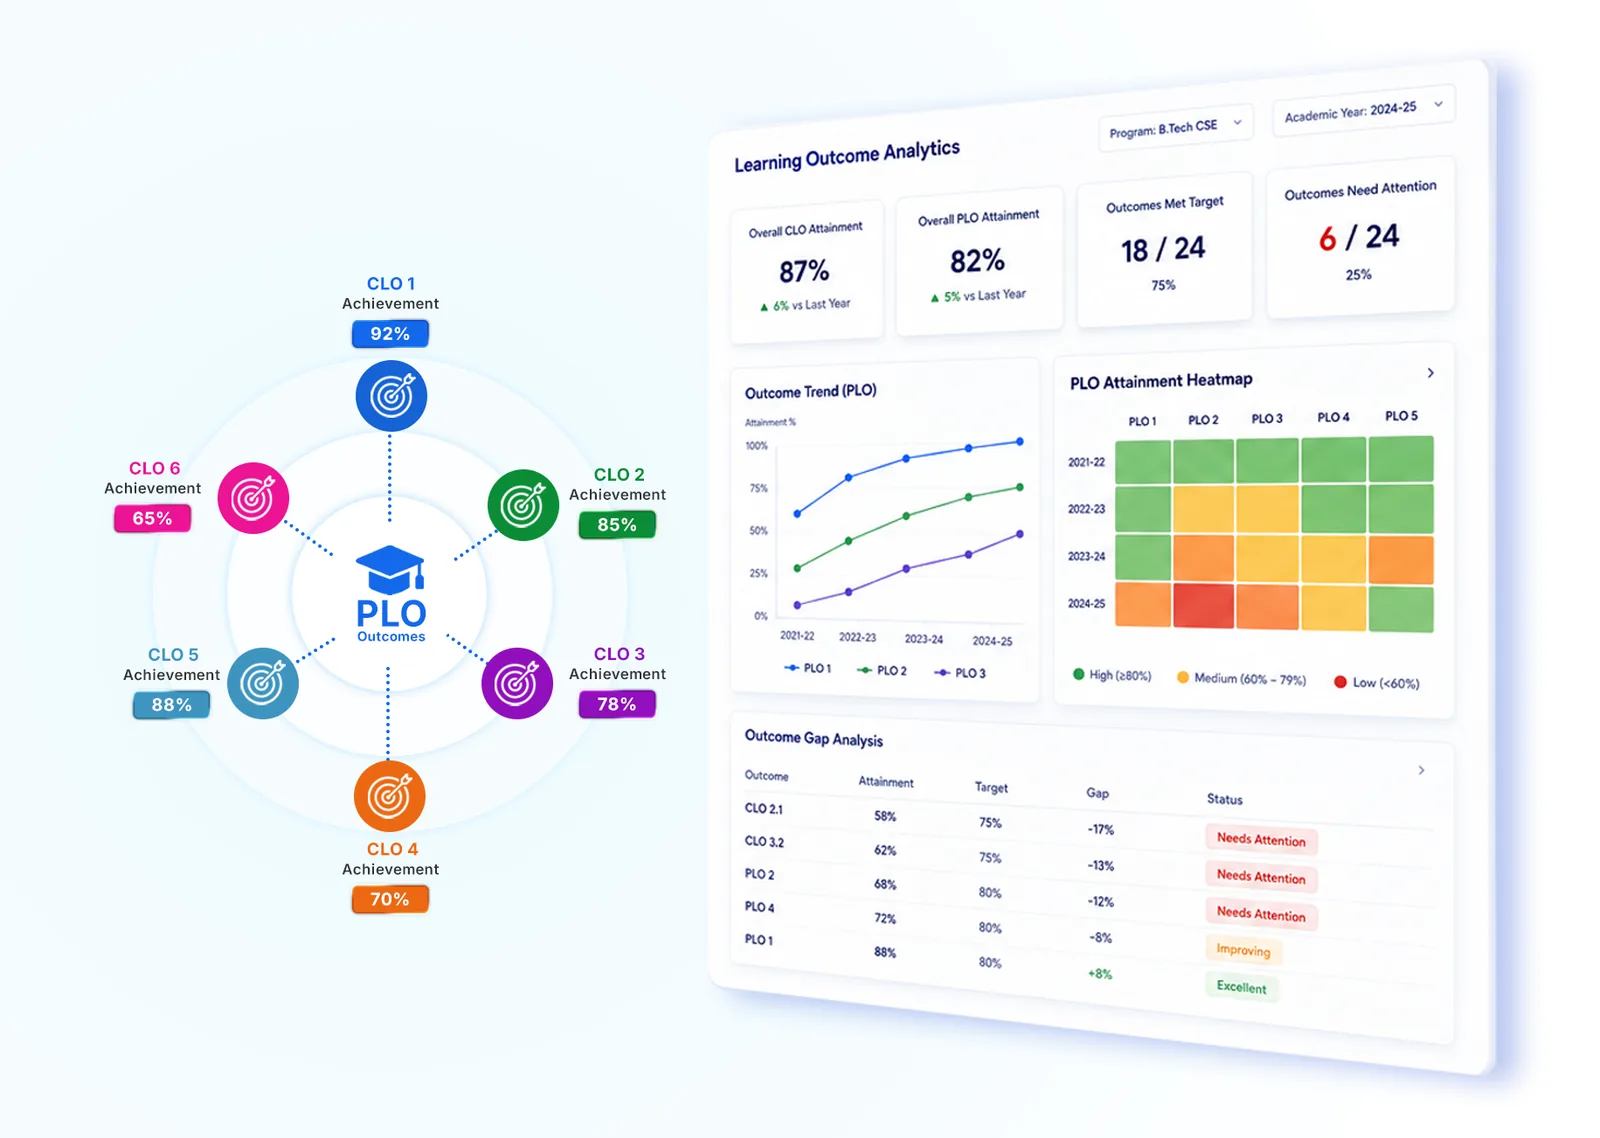
The same evidence, viewed at the level each decision needs. These aren't four reporting products. They're four lenses on one record.
Show learners where the evidence says to improve.
Strengths, gaps, competency progression and taxonomy performance across multiple assessments, with recommended focus areas.
Turn the course report into an improvement tool.
CLO attainment, performance distribution, assessment-quality analysis and continuous-improvement insights in one structured report.
See the pattern across assessments, not one result.
Cumulative performance, outcome measurement and longitudinal analytics across multiple assessments, courses and academic periods.
Different institutions need different views.
A custom report builder for institution-specific requirements: choose the level, evidence type and period, and reuse the structure.
See the Gap While There Is Still Time to Act.
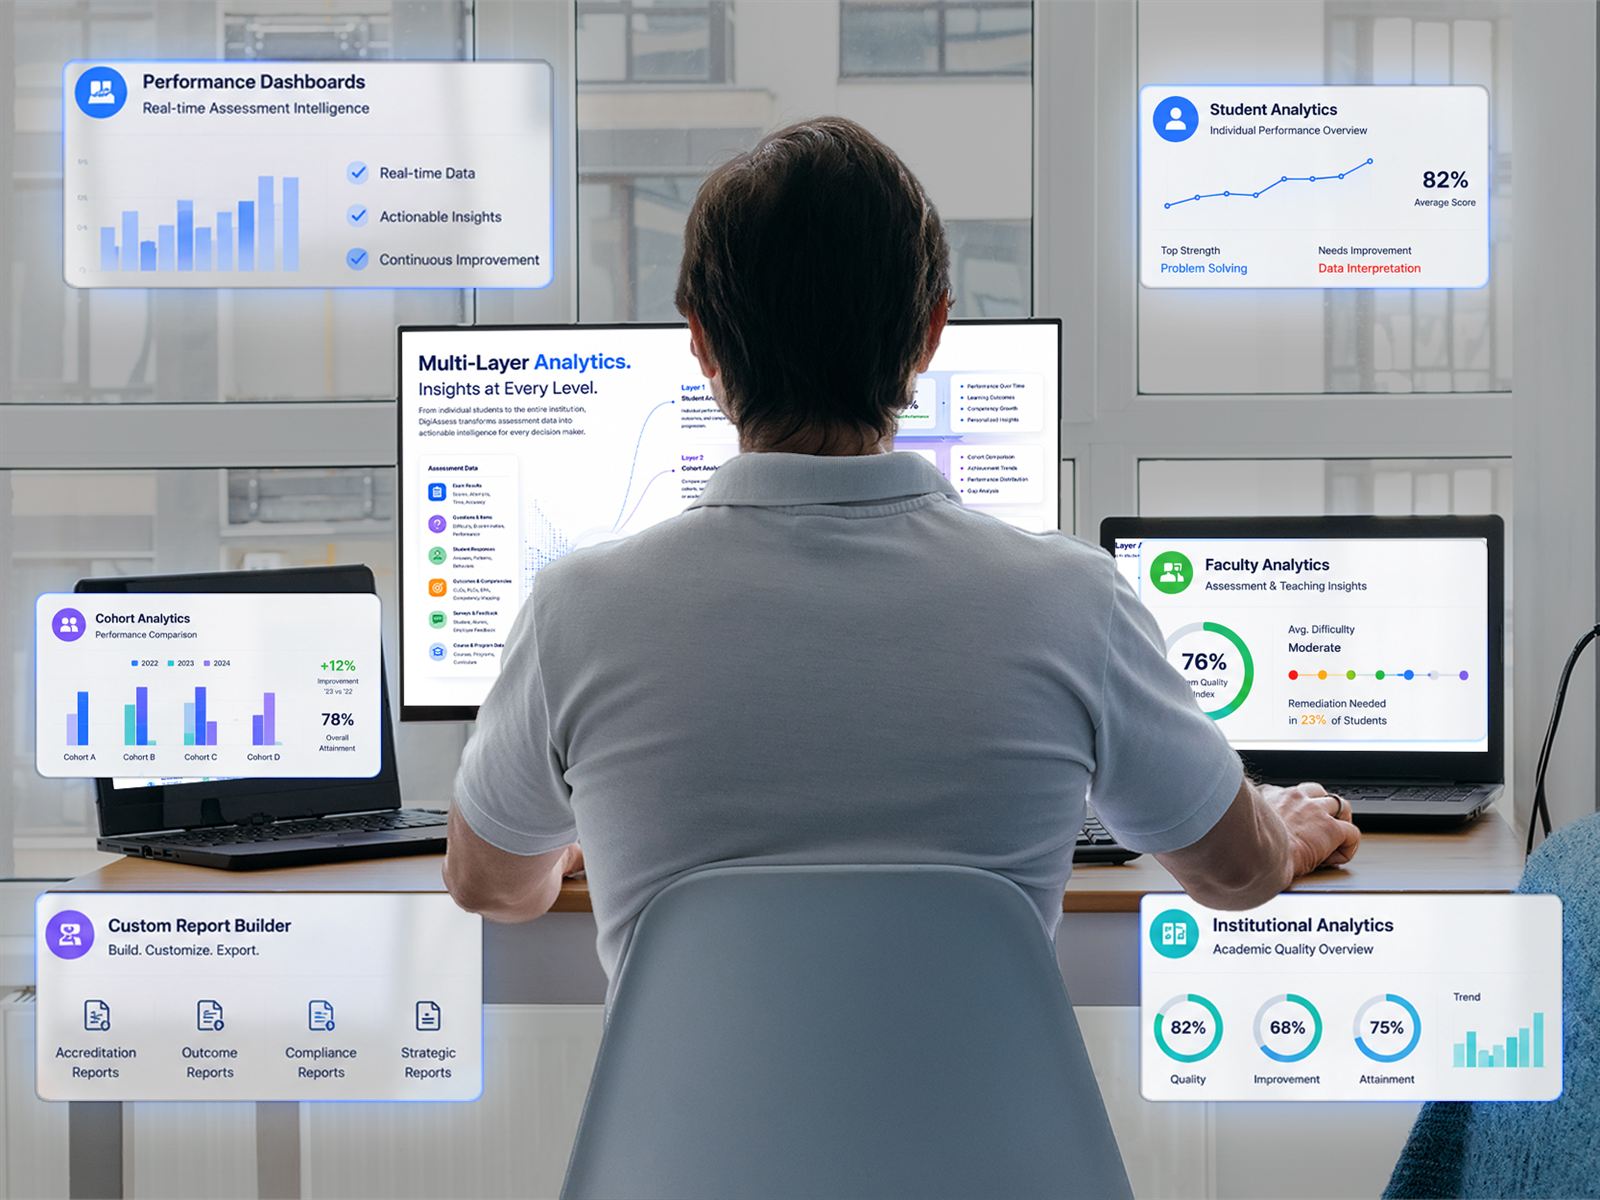
Identify under-performing outcomes, learner groups or competencies before they become year-end findings. DigiAssess highlights the pattern. Educators decide what to do about it.
Sample attention map.
Know Whether the Assessment Worked as Intended.
An exam can produce marks while containing items that are too easy, too hard or poor at telling strong and weak performance apart. Item analysis makes assessment quality visible.
| Item | Difficulty | Discrimination | Point-biserial | Review |
|---|---|---|---|---|
| Q3 | 0.62 | 0.41 | 0.38 | Good |
| Q7 | 0.94 | 0.08 | 0.06 | Too easy |
| Q11 | 0.48 | 0.36 | 0.33 | Good |
| Q14 | 0.21 | -0.05 | -0.04 | Check key |
| Q19 | 0.55 | 0.29 | 0.27 | Good |
Sample data. Reliability indicators are reported for the whole assessment.
Difficulty index
The share of candidates who answered correctly. Very high or very low values suggest the item isn't separating levels of understanding.
Discrimination index
Whether stronger candidates answer correctly more often than weaker ones. Negative values often signal a flawed item or answer key.
Distractor efficiency
Whether each wrong option is actually chosen by some candidates. Options nobody picks add nothing.
Point-biserial correlation
How closely performance on the item tracks performance on the whole assessment.
Reliability indicators
How consistently the assessment as a whole measures what it's meant to measure.
Outcomes Are Stronger When Performance and Perception Are Read Together.
Assessment shows what learners demonstrate. Surveys show how learners, faculty, alumni and employers perceive achievement. They answer different questions, and both belong in the evidence.
- Assessment scores and rubrics
- Assignments and practicals
- Outcome and competency attainment
- Outcome-based surveys mapped to CLOs, PLOs and competencies
- Student, faculty, alumni and employer feedback
- KPI dashboards and AI-assisted sentiment analysis
AI Can Find the Pattern. Academics Decide What It Means.
AI accelerates analysis, evaluation and reporting. Academic meaning depends on context, so the final decision stays with authorized educators and leaders.
Cohort 2027 under-performs on 14 data-interpretation items mapped to CLO 3.2, across three assessments.
The course lead checks the source items, confirms the pattern and adds it to the curriculum committee agenda. The decision is recorded.
Illustration with sample data.
Don't Build Accreditation Evidence Twice.
Quality teams often rebuild the same evidence in different formats for different frameworks. Keep one evidence base and reuse it across the reporting contexts you answer to.
Student outcome evidence for applied science, computing and engineering programs, drawn from routine assessment.
Competency, milestone and EPA evidence from theory, OSCE, workplace and portfolio assessment.
Course and program learning outcome evidence for Saudi national accreditation.
Program outcome evidence for UAE academic accreditation.
Competency and EPA evidence for UAE medical education frameworks.
Curriculum structures and outcome evidence for Indian medical, institutional and technical education frameworks.
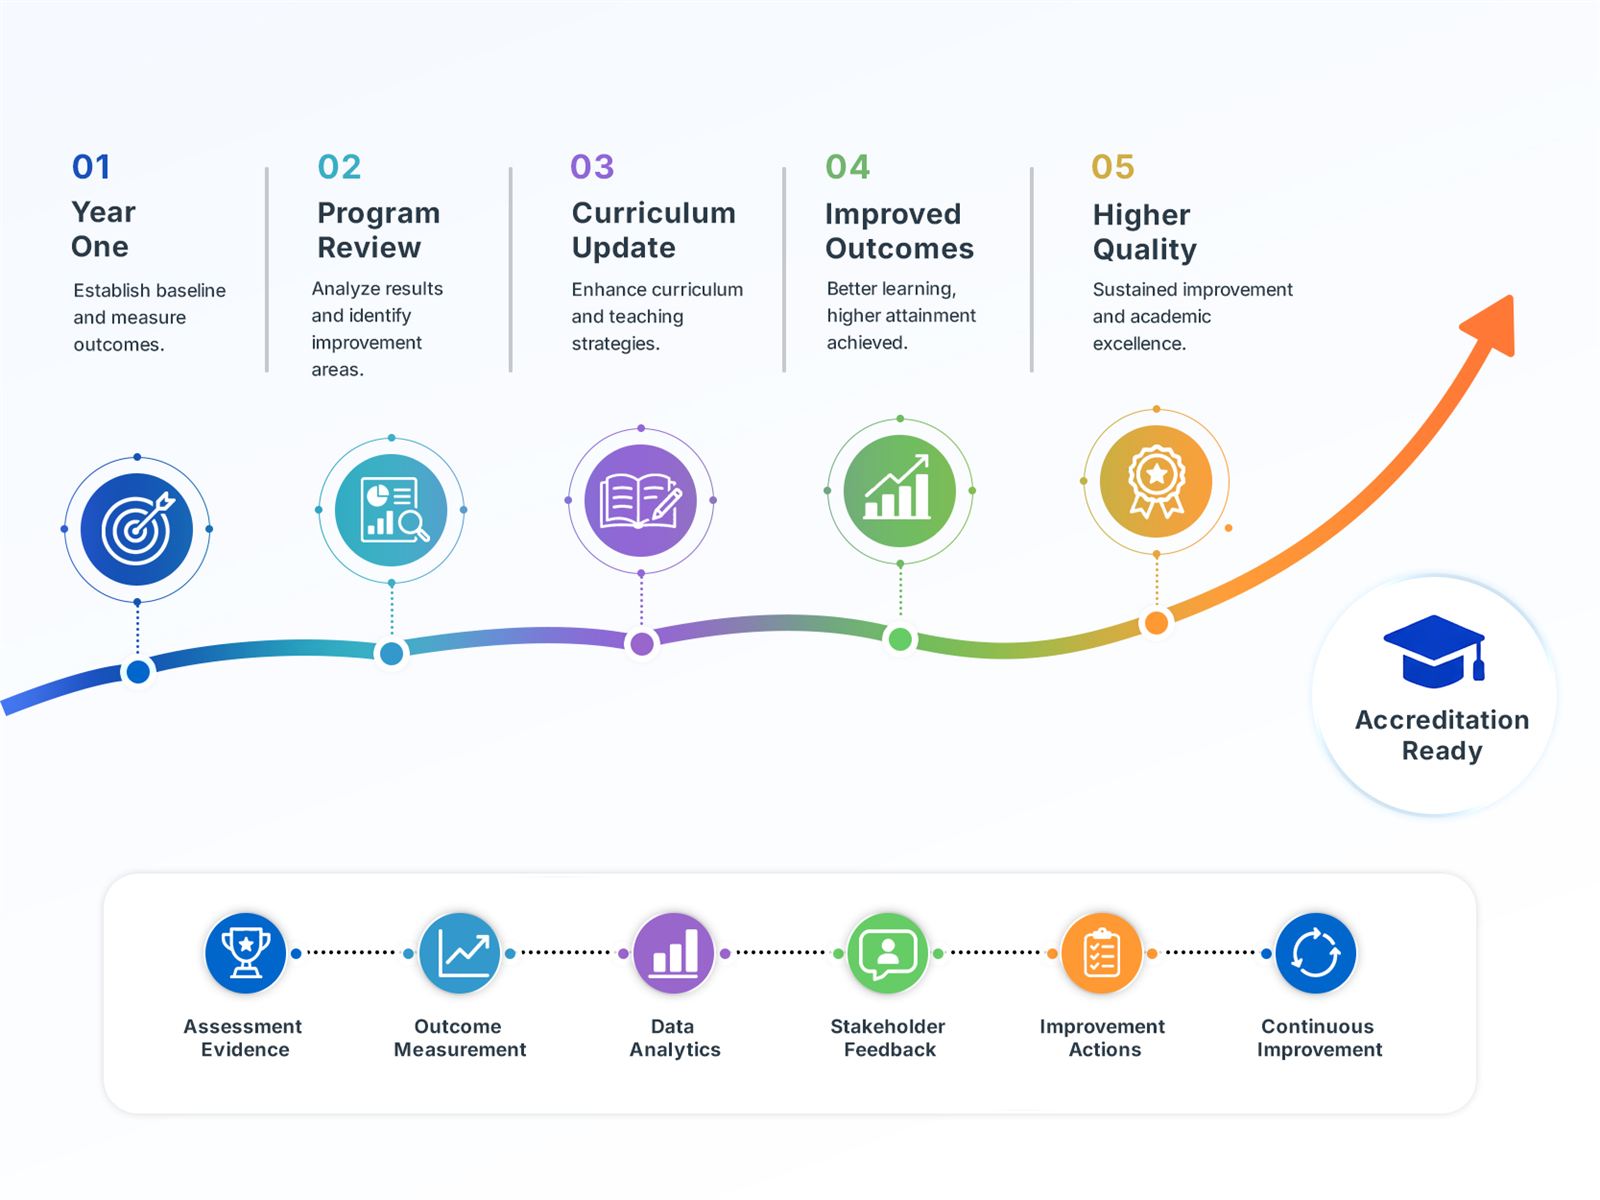
Accreditation Preparation Should Be the Output of Continuous Quality Work.
Q360 extends the evidence layer into governed quality workflows, so evidence, approvals and improvement actions build up all year.
- Structured QA workflows and approvals.
- Evidence repository linked to assessment and outcomes.
- Institutional dashboards and accreditation tracking.
- Automated report generation.
Turning assessment evidence into outcomes and accreditation reports? See learning outcome analytics, outcome-based assessment and competency-based assessment.
Assessment Data → Evidence → Academic Intelligence → Improvement.
See how this works for your institution's context.